Users need the Admin role to create and edit Docs. Analysts have read-only access.
Doc principles
- Fi does the heavy lifting: Describe what you want in plain English, and Fi builds it for you. You don’t need to write SQL or configure visualizations unless you want to.
- Docs are built from tiles: Each tile displays a piece of data: a KPI, chart, table, or markdown. Combine tiles to tell a complete story.
- Everything saves automatically: Your Doc saves as you work. No manual save required.
The Docs interface
When you open a Doc, you’ll see four main areas: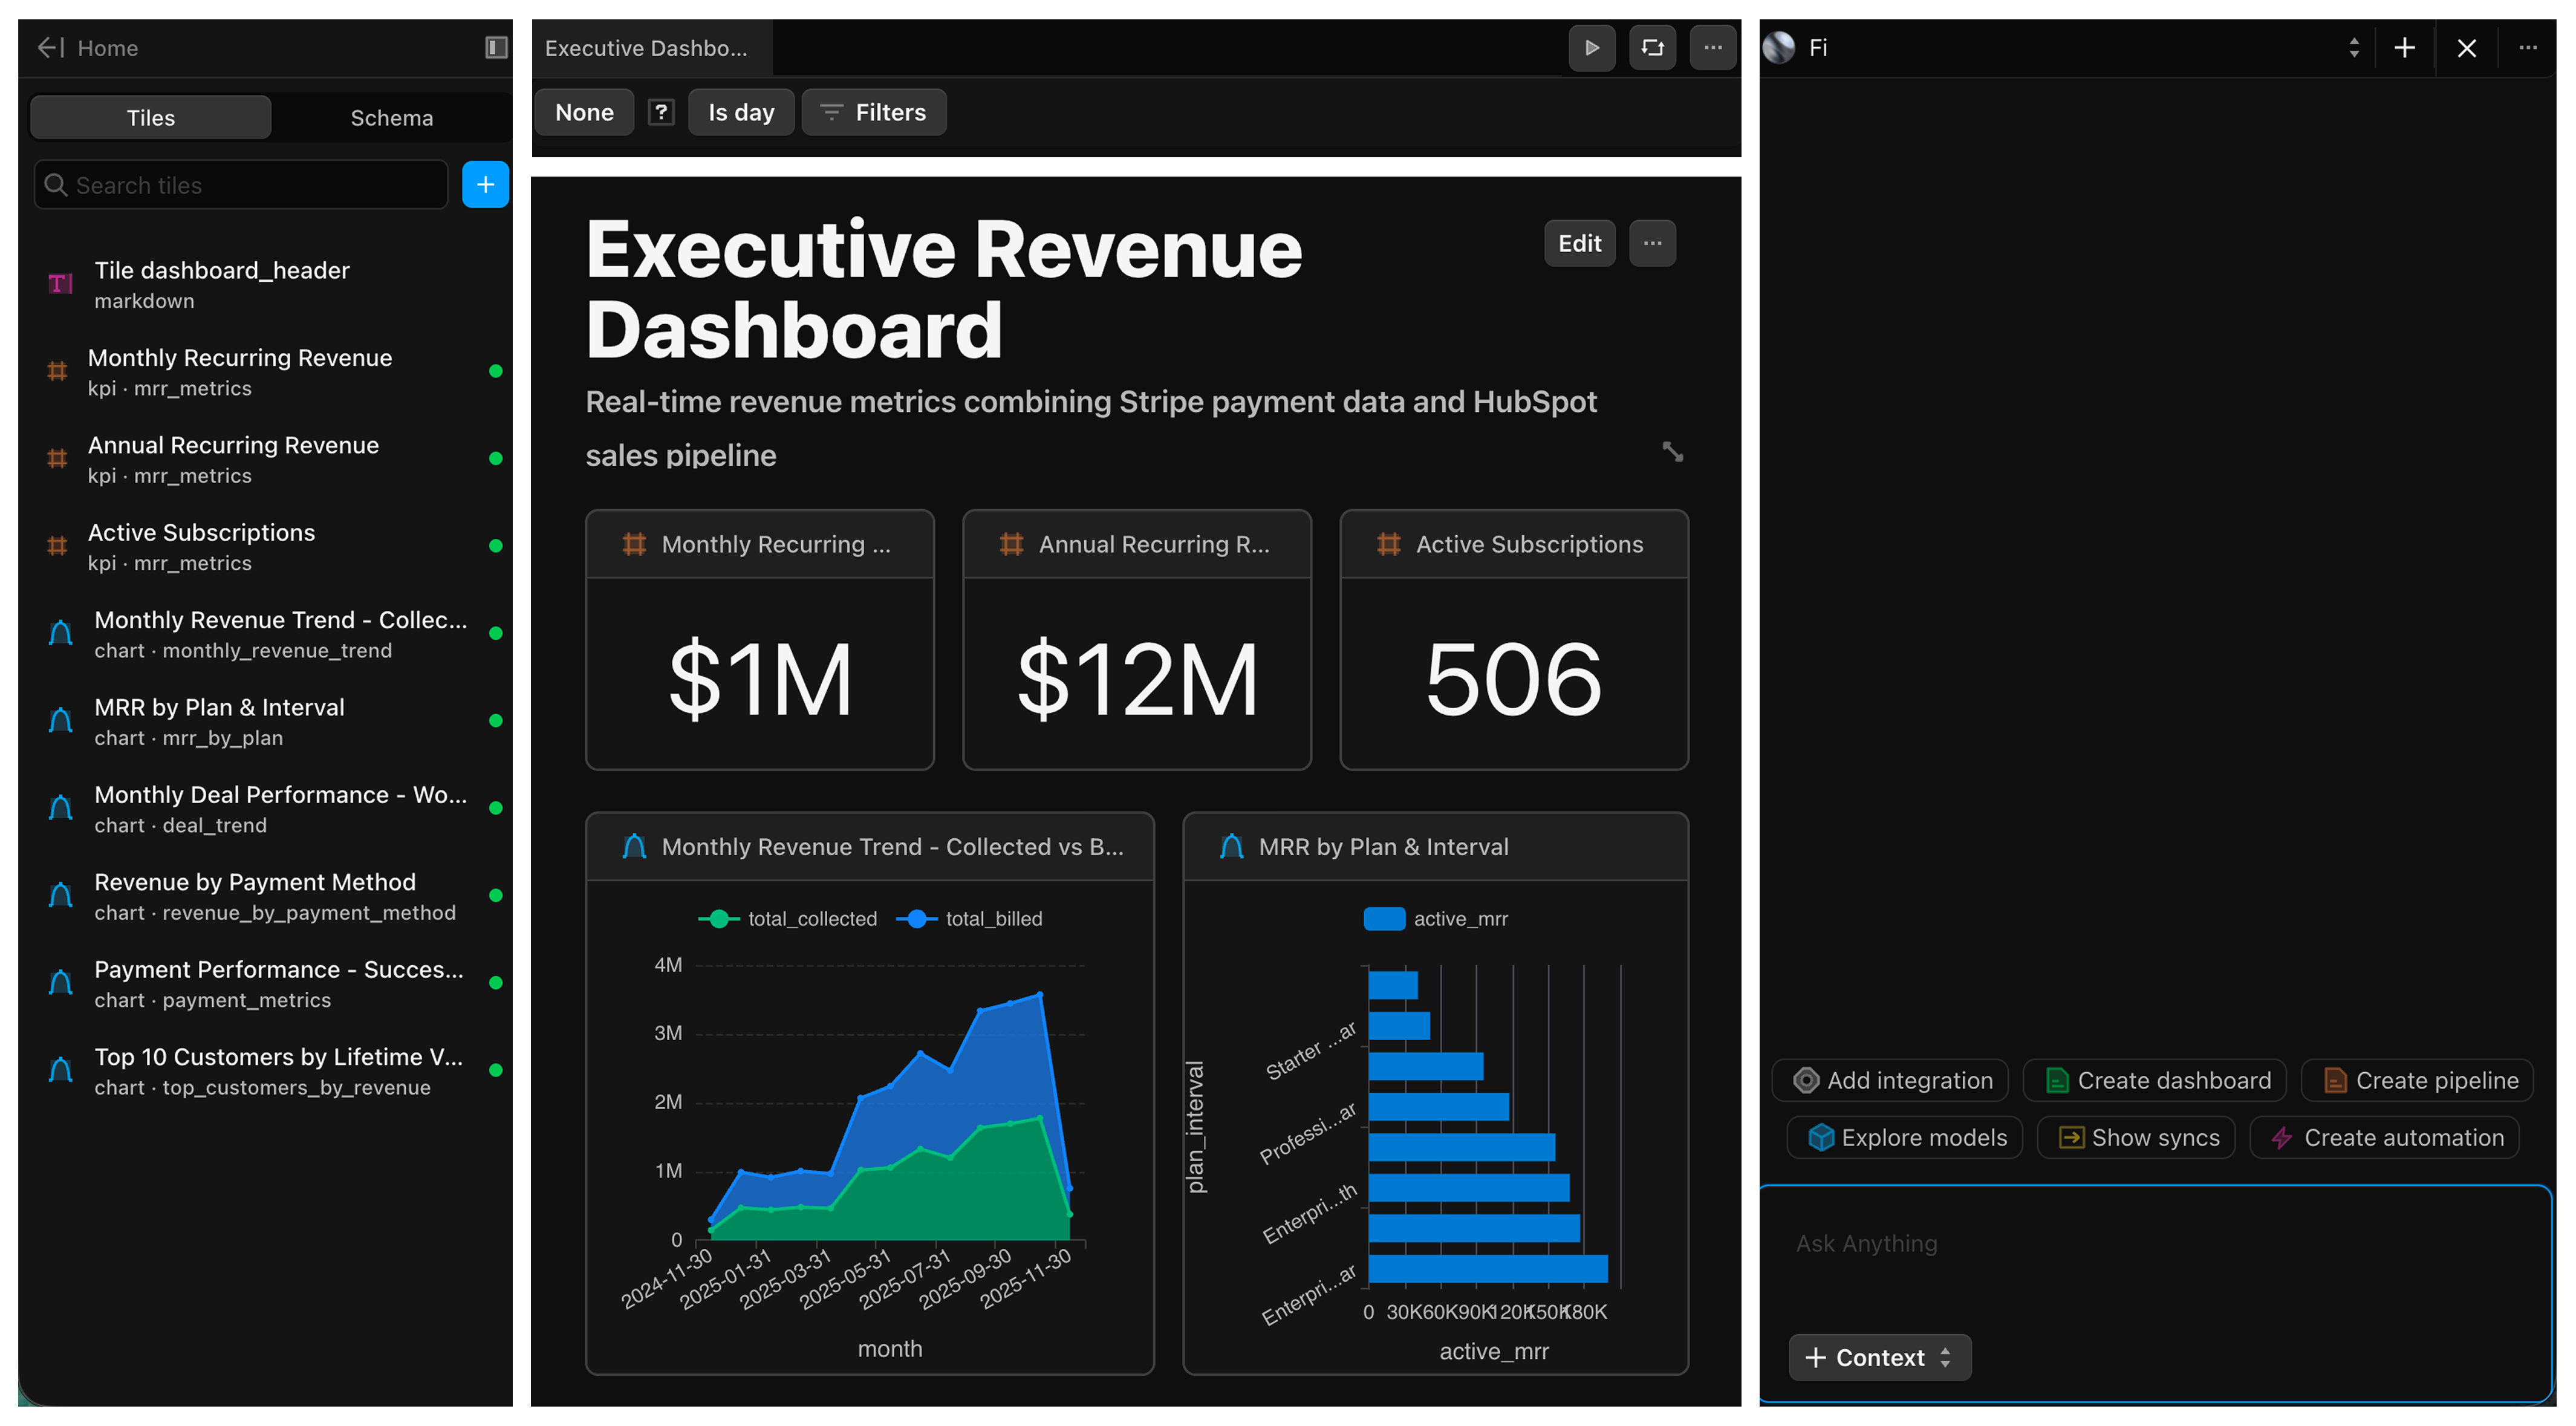
Left panel
The left panel helps you navigate and manage your Doc:- Tiles: Browse all tiles in your Doc, see their types (chart, kpi, markdown), and click to jump to any tile
- Schema: Explore your connected data sources, schemas, tables, models, etc.
Main canvas
The main canvas is where your report lives. This is where you view and arrange your tiles.When you open a new Doc, it starts empty. Fi is ready to help you add your first tile.
Right panel
Fi, Definite’s AI assistant, lives in the right panel. Fi helps you build and maintain your Doc using natural language:- Ask questions: “How much revenue did we collect last month?”
- Create tiles: “Add a bar chart showing sales by region”
- Edit and debug: “Change this chart to show the last 12 months” or “Why is this query failing?”
Top toolbar
| Control | Description |
|---|---|
| 📅 Period | Set the time range for your entire Doc (e.g., last 90 days) |
| 📏 Granularity | Define how data is grouped (daily, weekly, monthly) |
| 🔍 Filters | Apply global filters that affect all compatible tiles. Learn more about filters. |
| 🔄 Refresh | Pull the latest data from your connected sources |
| ✏️ Edit | Rearrange and resize tiles in your Doc |
| ⋯ More options | Settings, Share, Clear Cache, View YAML, Archive |
Creating a Doc
Give your Doc a name that describes its purpose (e.g., “Executive Revenue Dashboard”, “Sales Pipeline Overview”).
Adding tiles
You can add tiles in two ways: using Fi or manually.Using Fi
The fastest way to get started is to ask Fi for what you want:- In the Fi panel, type a request like “Show me total revenue collected in the last 90 days as a KPI”
- Fi creates the tile with the appropriate query and visualization
- The tile appears in your Doc, ready to customize

Manually adding a tile
- Click the + button in the Tiles panel on the left sidebar
- Choose the tile type (KPI, Chart, Table, or Markdown)
- Write your SQL or Python query
- Configure the visualization settings
Building your dashboard
Continue adding tiles to create a complete dashboard:- Start with KPIs: Add high-level metrics at the top for quick insights
- Add charts: Visualize trends and comparisons in the middle section
- Include tables: Show detailed data for users who want to dig deeper
- Use markdown: Add headers and descriptions to organize your Doc
Working with data
Docs connect to your existing data sources:- Query your warehouse: Write SQL against Snowflake, Postgres, BigQuery, or other connected databases
- Use Python: Run Python code for complex transformations
- Upload files: Drag a CSV onto your Doc to analyze local data alongside your warehouse. Learn more about uploading files.
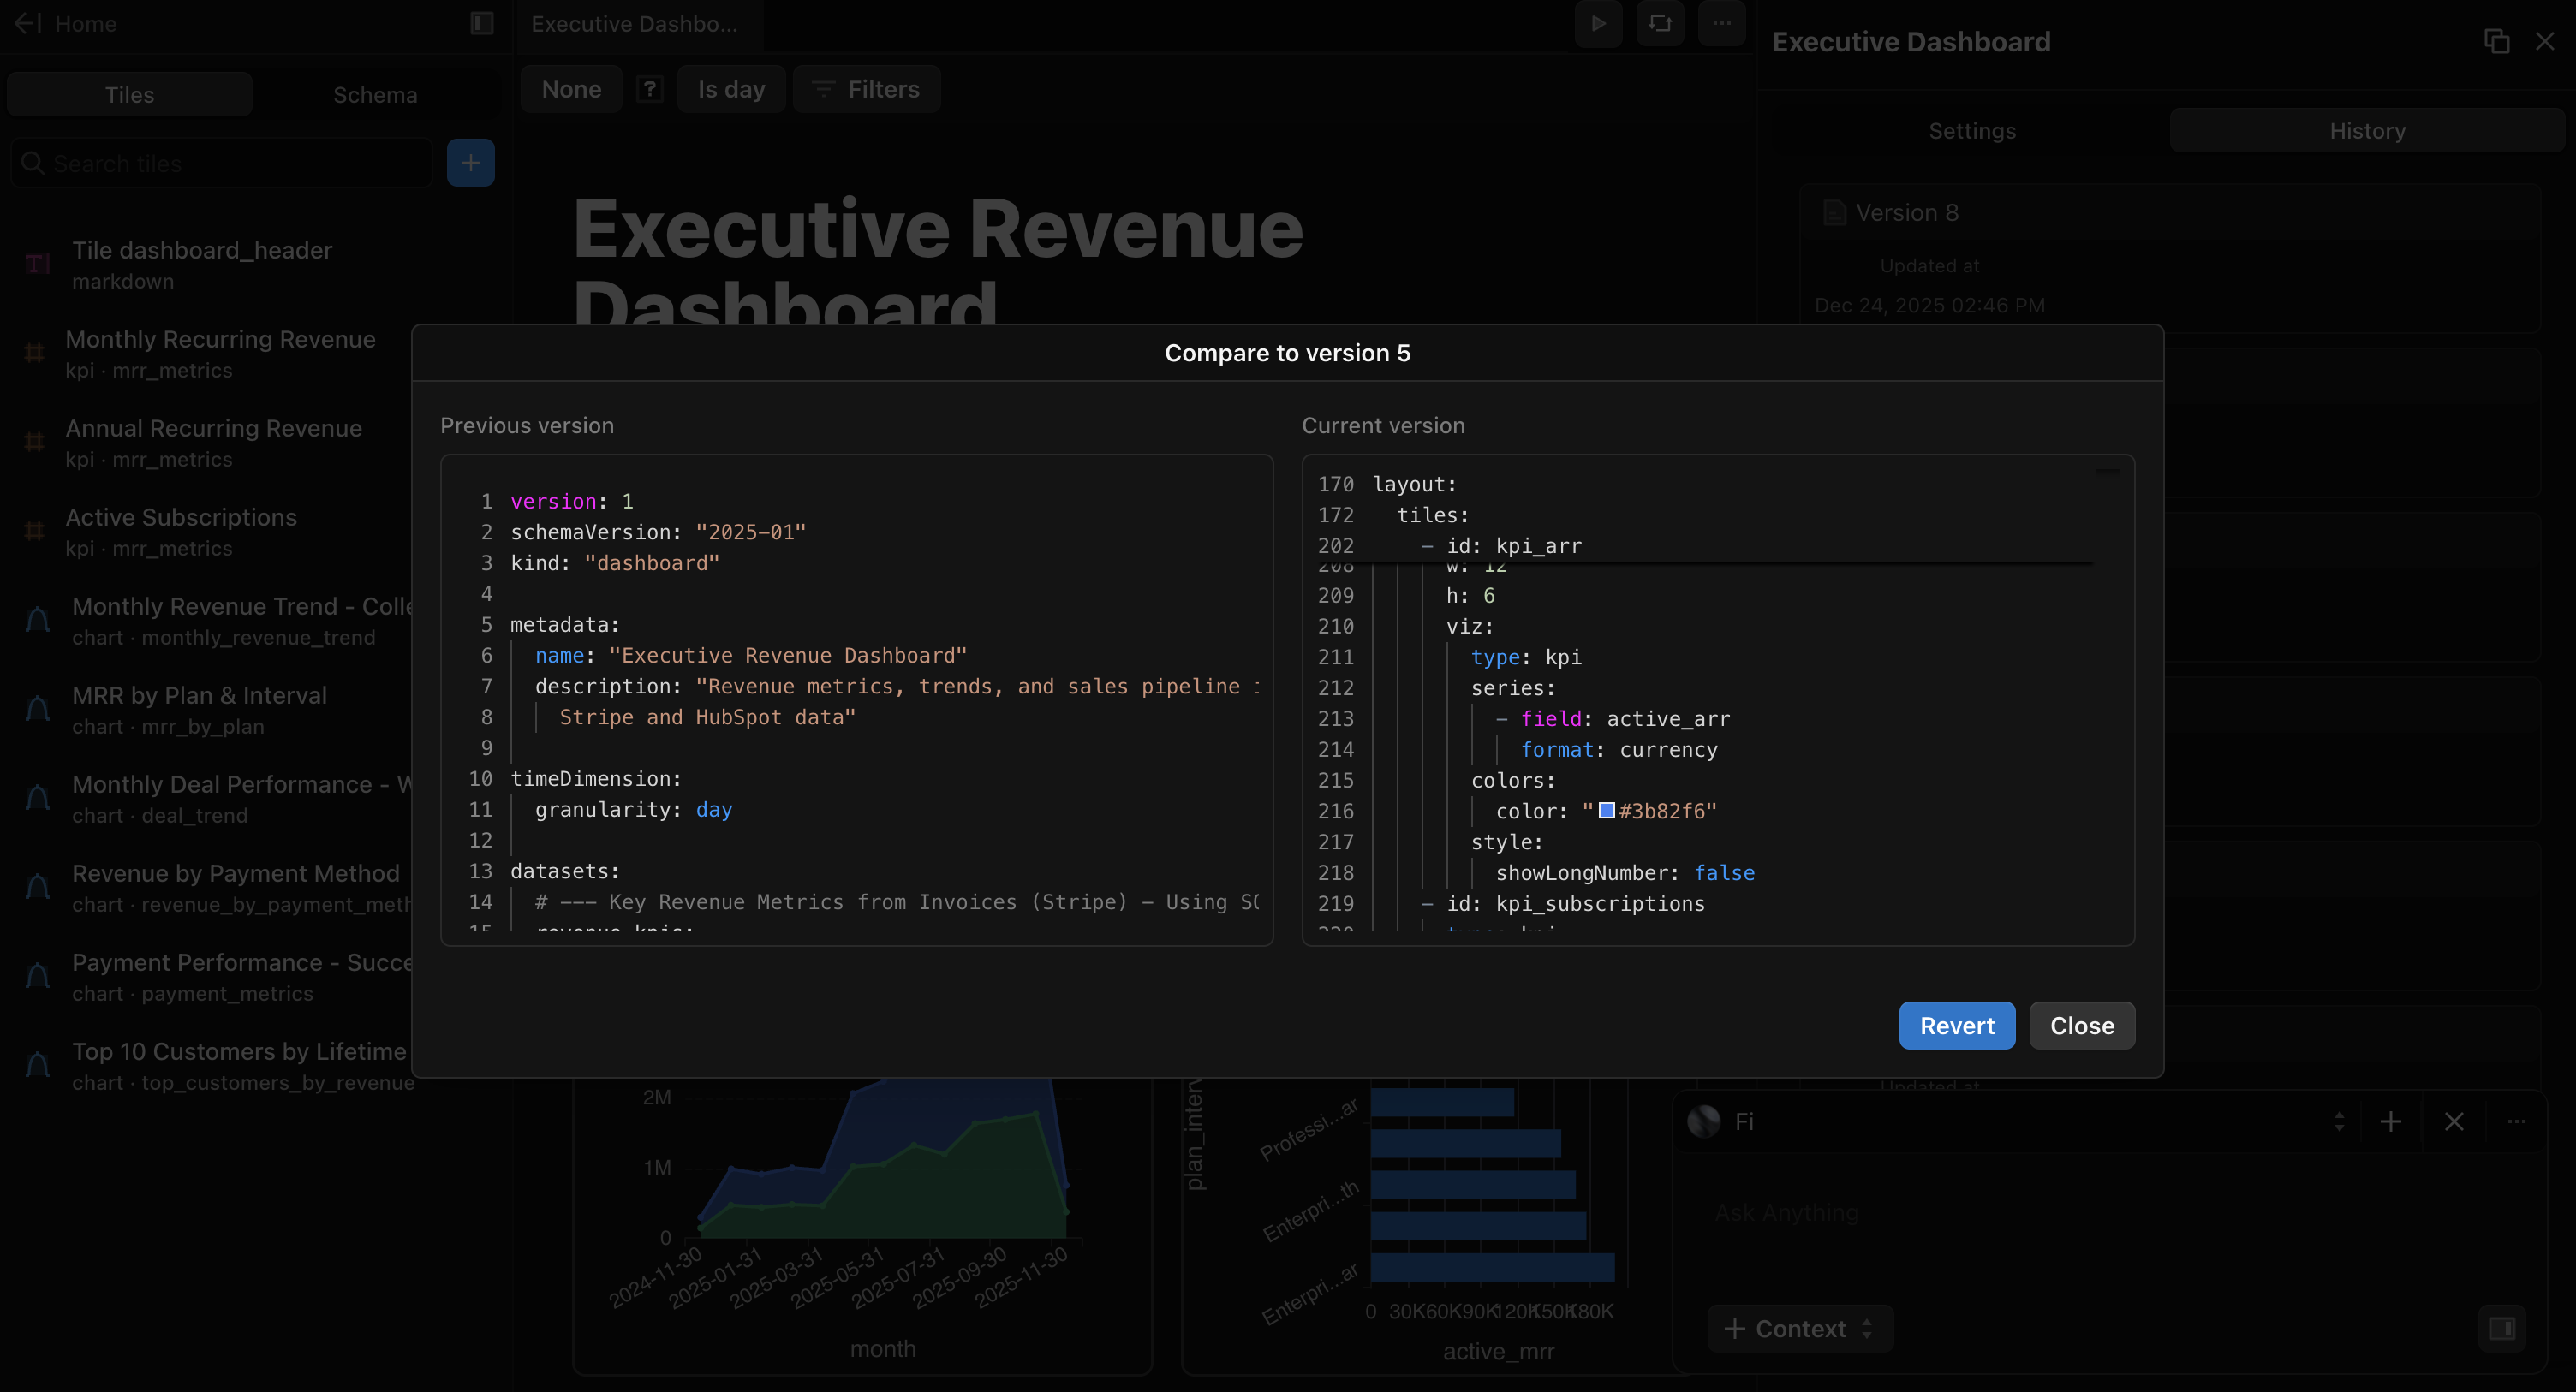
Version history
Definite automatically tracks changes to your Doc. To access previous versions:- Click the ⋯ More options menu in the top toolbar
- Select Settings and then Versions
- View your version history and restore any previous version
Next steps
Creating and Managing Docs
Organize, share, and manage your Docs
Introduction to Tiles
Learn about tile types and how to configure them