Now that you’ve connected your data, you’re ready to build your first Doc. Docs are interactive dashboards where you visualize data, track metrics, and share insights with your team.Documentation Index
Fetch the complete documentation index at: https://docs.definite.app/llms.txt
Use this file to discover all available pages before exploring further.
Create a new Doc
Click + New Doc from the home screen. Give your Doc a name that describes its purpose, like “Revenue Dashboard” or “Sales Pipeline Overview.”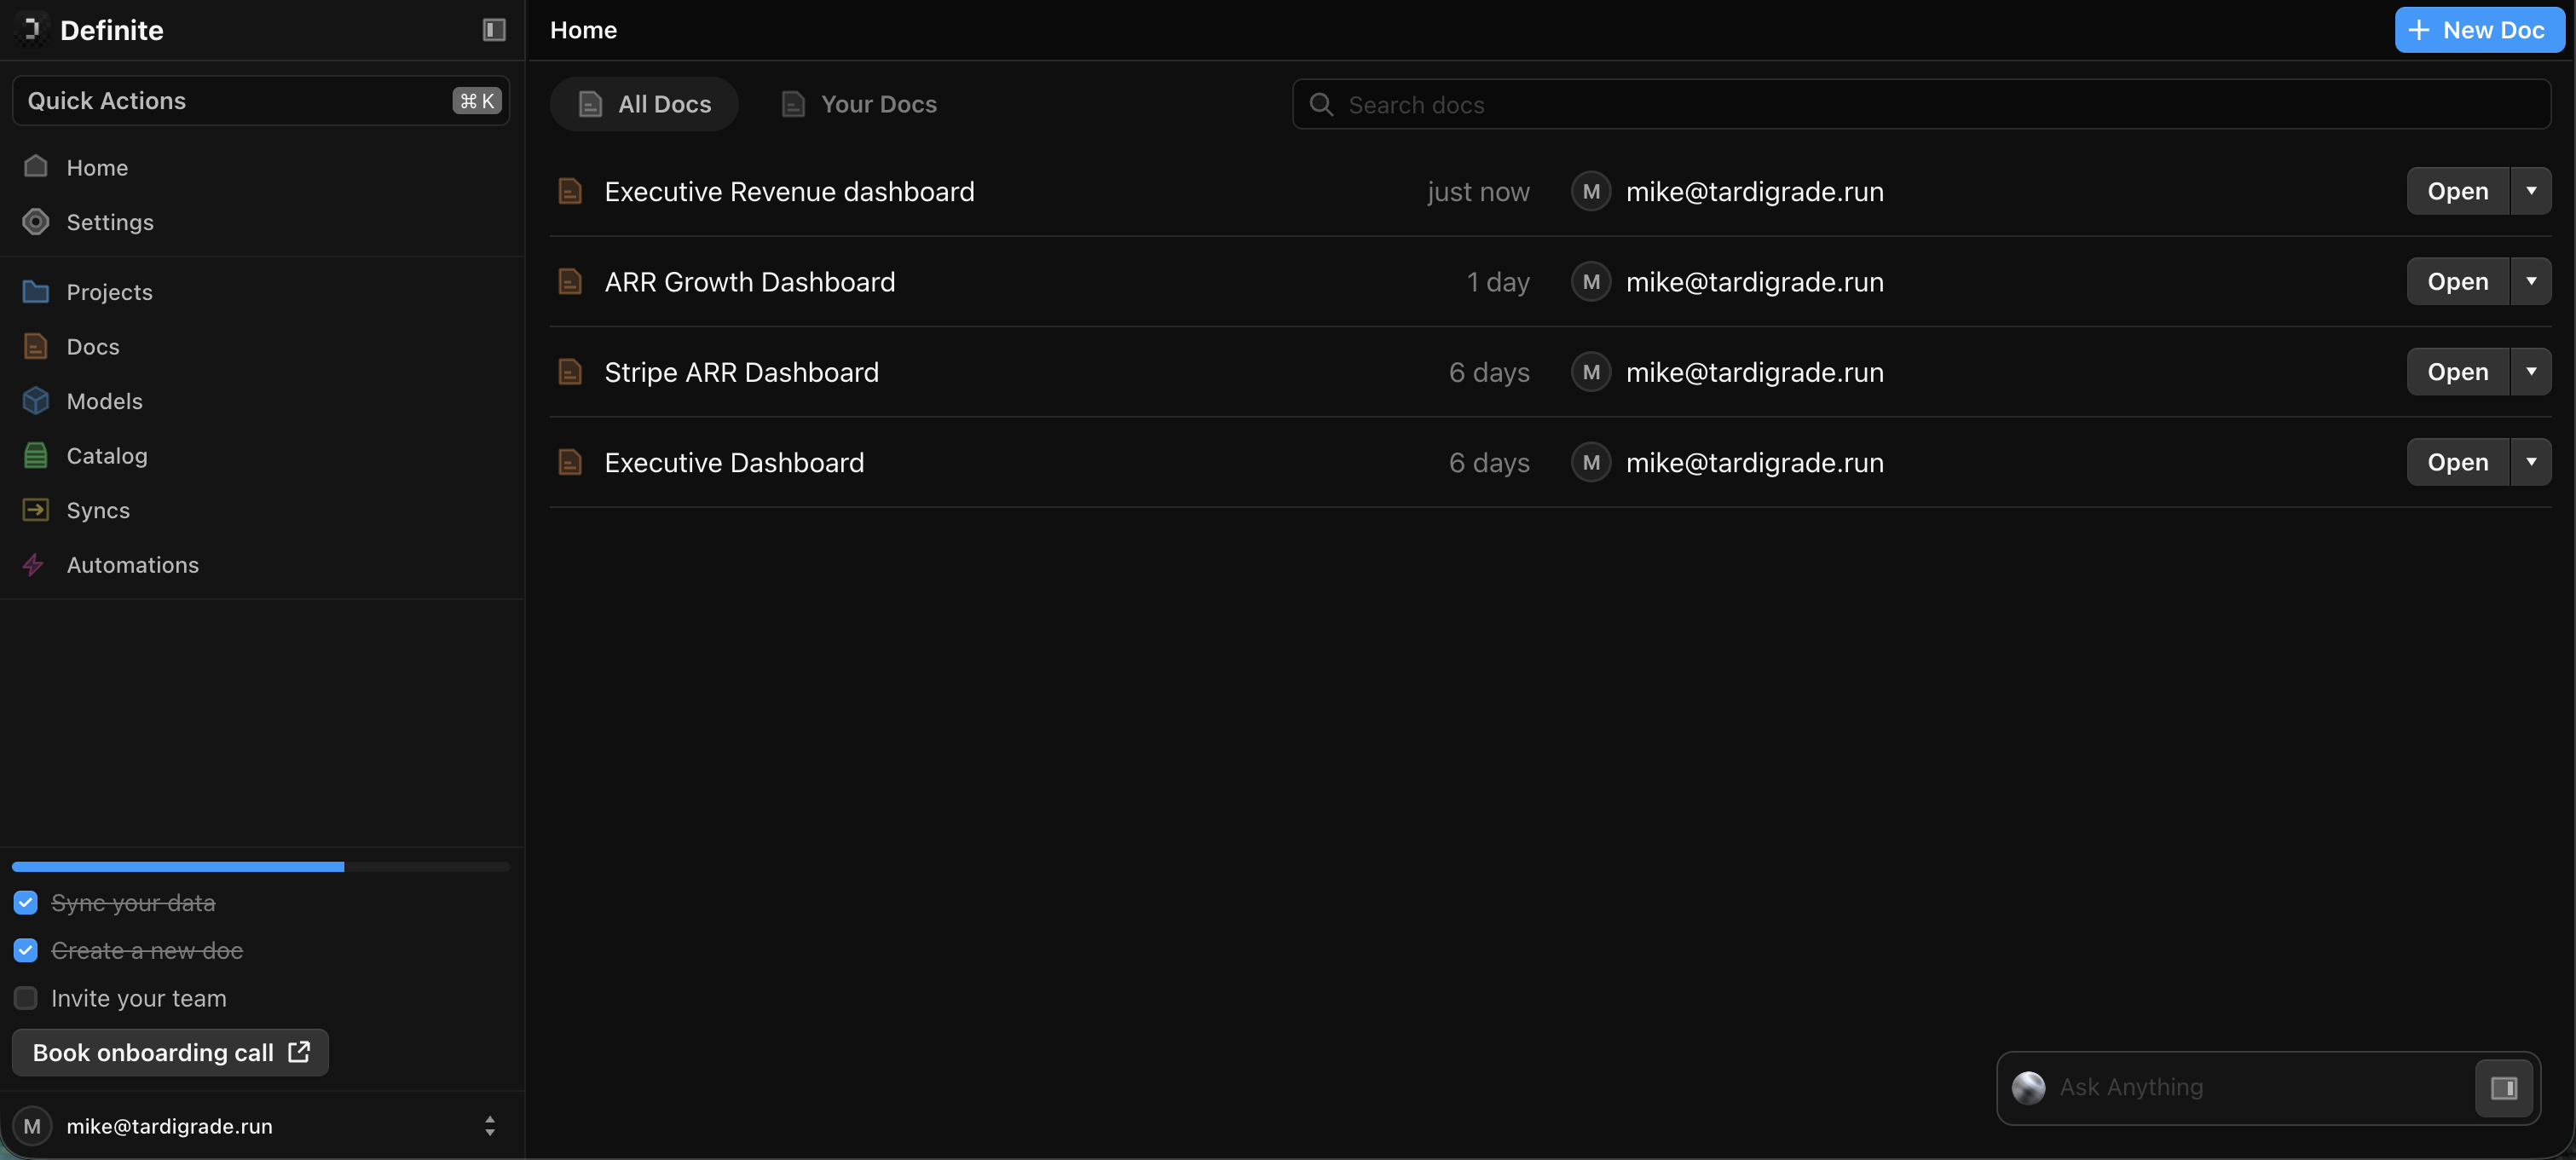
Add tiles with Fi
The fastest way to build a Doc is to ask Fi. Type a prompt like “Build a KPI dashboard” or “Show me revenue trends over the last 6 months” and Fi creates the tiles, queries, and visualizations for you.
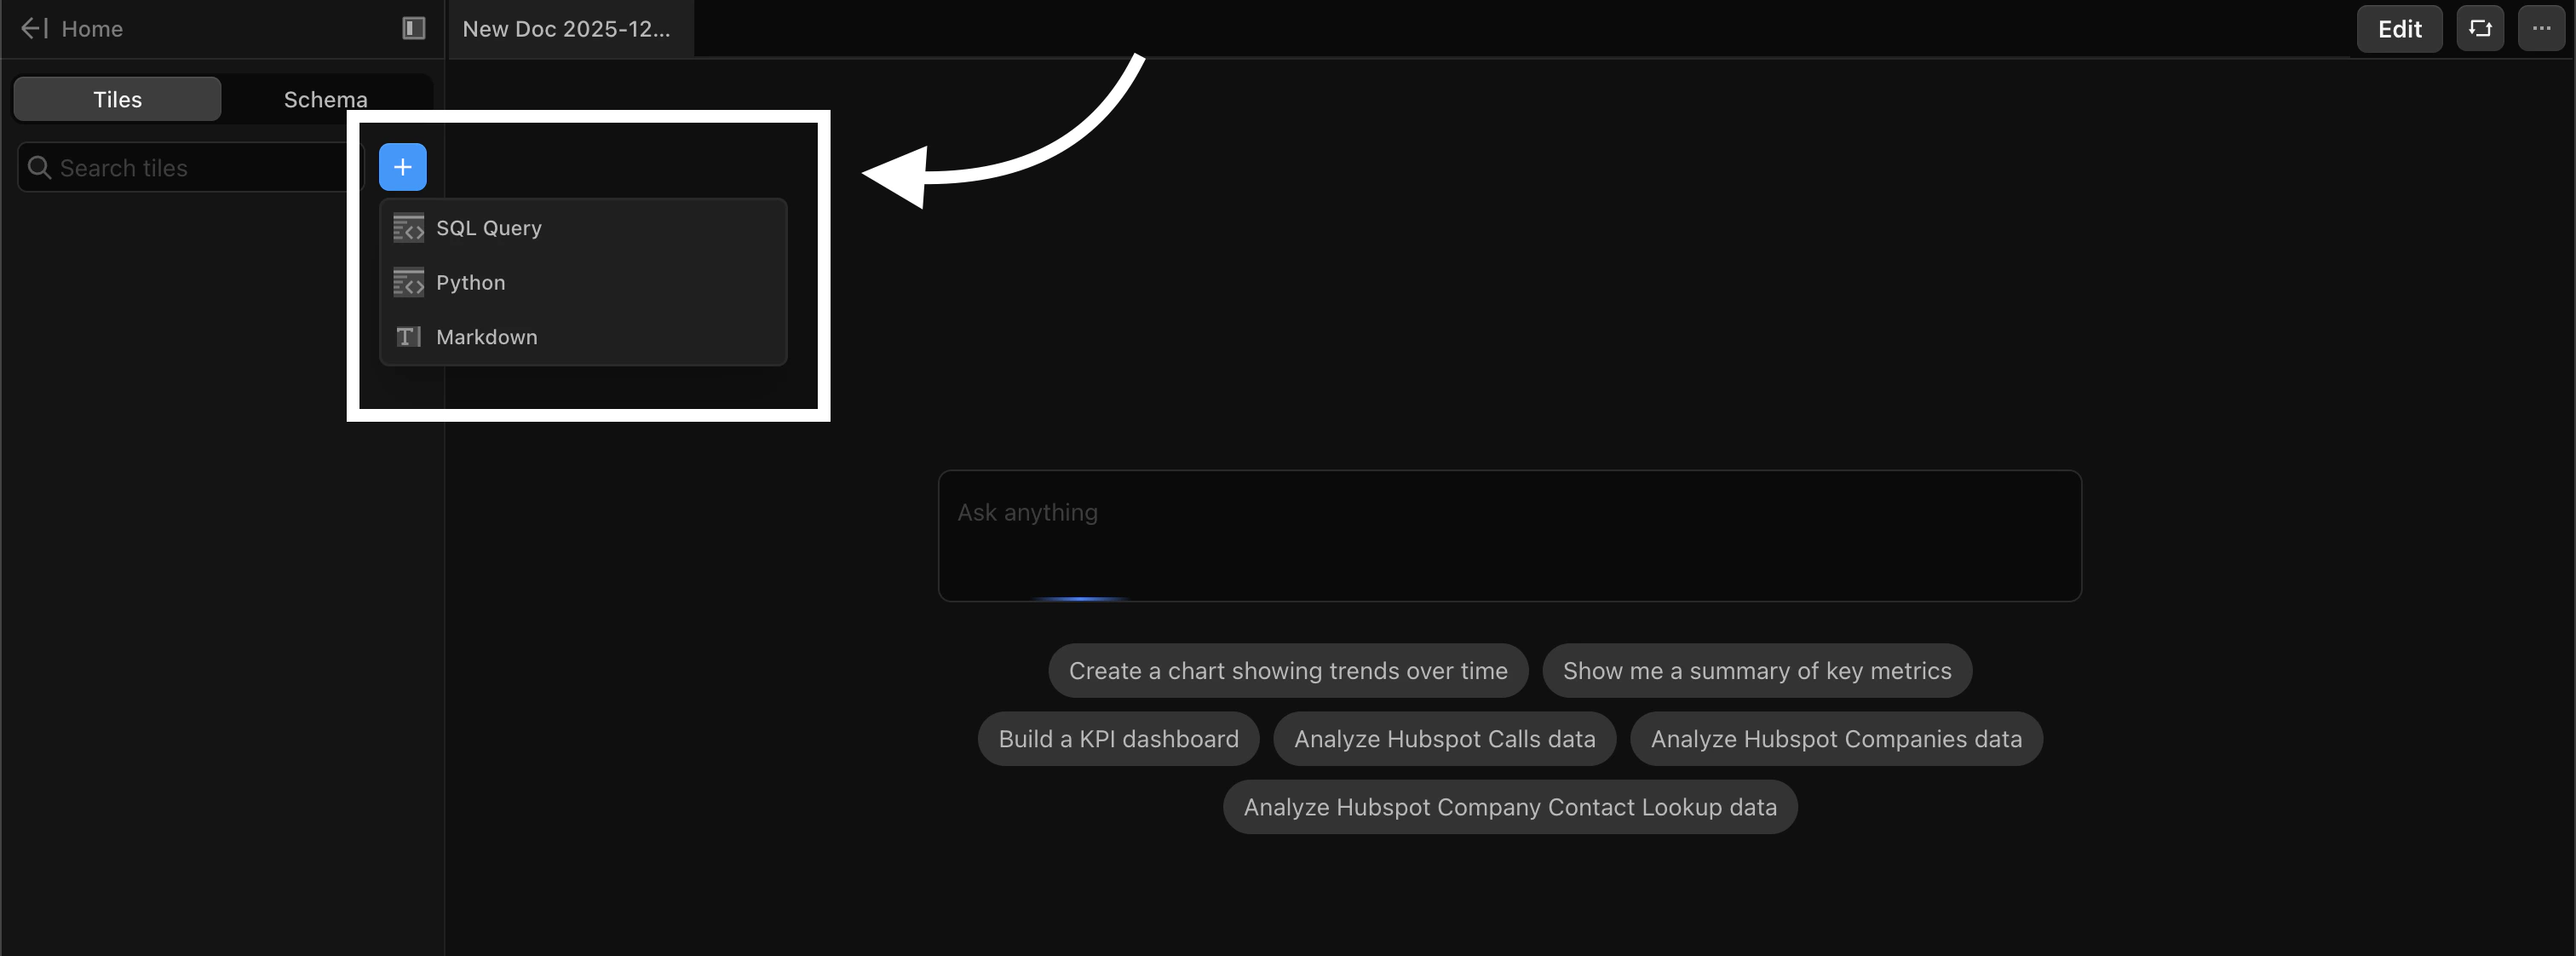
Add tiles manually
You can also add tiles yourself. Click the + button in the Tiles panel on the left sidebar and choose a tile type:- SQL Query - Write a SQL query to pull data
- Python - Use Python for more advanced analysis
- Markdown - Add headers, descriptions, or notes
Arrange your layout
Click the Edit button in the top toolbar to enter edit mode, then drag and resize tiles to arrange your dashboard.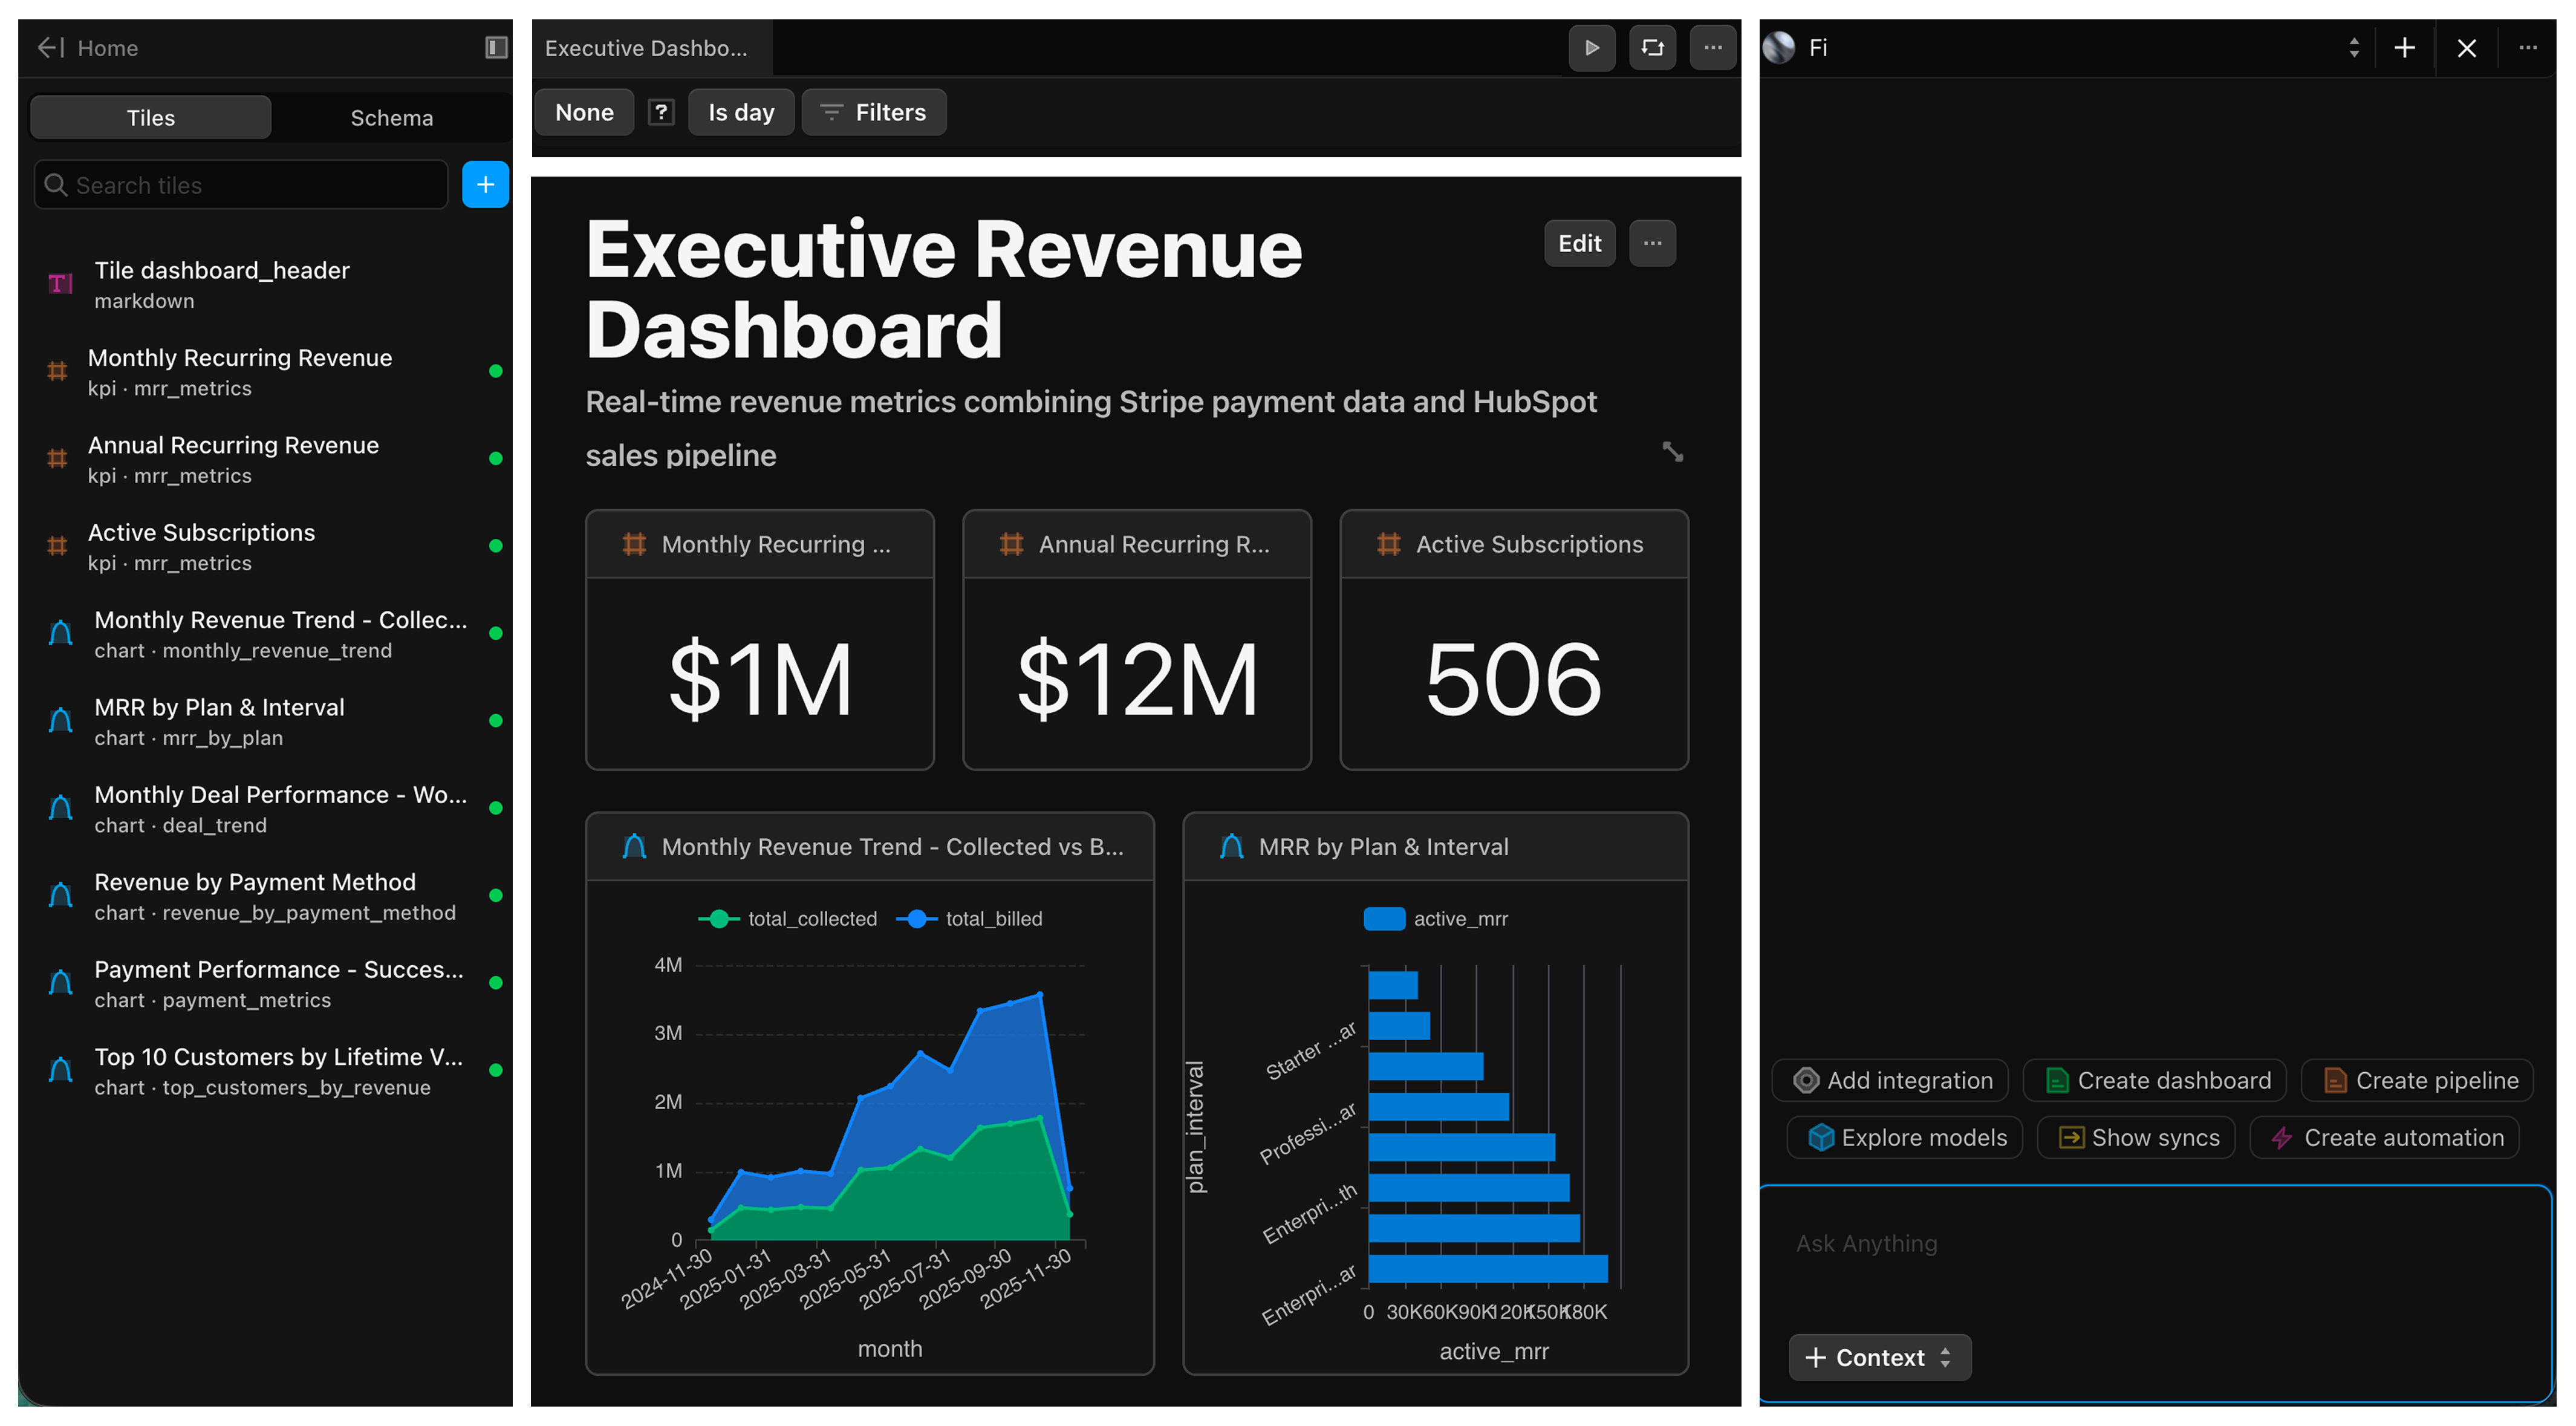
Next steps
Docs in Depth
Learn about managing, sharing, and organizing your Docs
Tile Types
Explore KPI, Chart, Table, and Markdown tile options